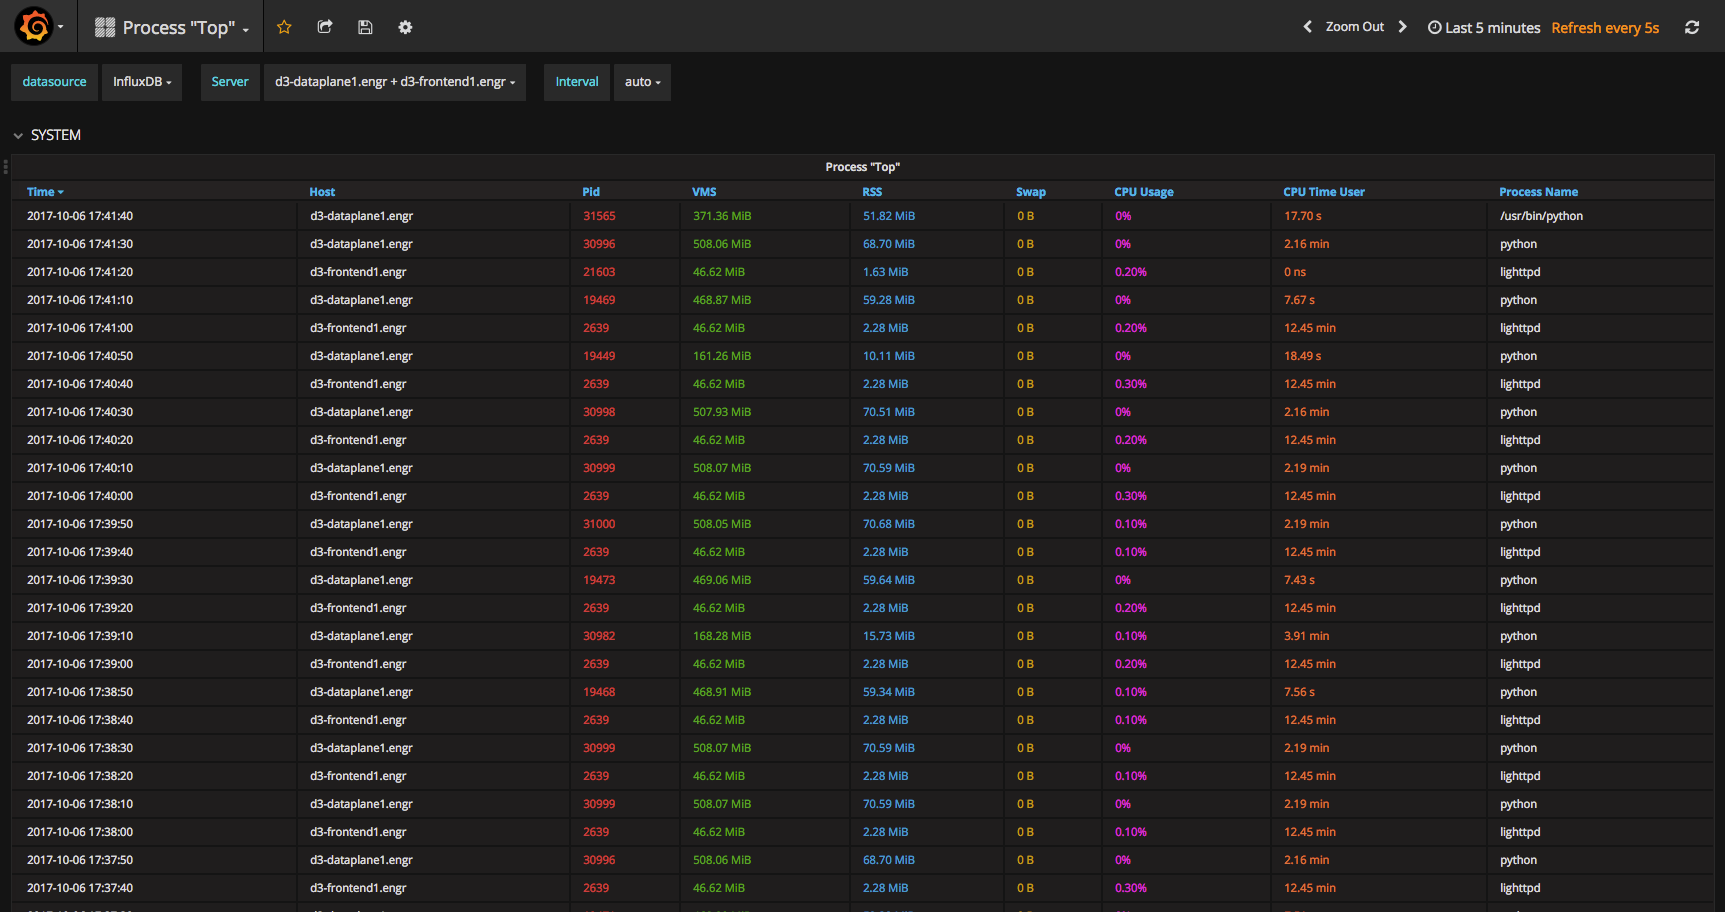
Mimic “top” Linux command - view processes and their system resource usage. Datasource: InfluxDB; Collector: Telegraf
https://grafana.com/grafana/dashboards/3387-process-top/

Shows processes similar to what “top” command shows. It shows:
- Host
- Pid
- VMS
- RSS
- Swap
- CPU Usage
- CPU Time User
- Process Name
作者:Jeebiz 创建时间:2023-02-21 10:05
最后编辑:Jeebiz 更新时间:2024-02-26 11:21
最后编辑:Jeebiz 更新时间:2024-02-26 11:21
